

By Waseem Aijaz, WordPress developer and SEO specialist. Last updated: 14 October , 2026. Data: NerdWallet’s October 2026 rates analysis, for a 35-year-old driver with good credit and a clean record. Look, this article is not only about the tool. I have explained many things and shared information that you may or may not already know. We also have some comments and reviews from people who have used the tool, so you can see their feedback and understand their experience while using it.
You can also read these reviews to learn more about how the tool works and how people have used it.
Quick answer: The average car insurance cost by state runs from $1,148 to $4,296 a year for full coverage. The US median is $2,361 a year (about $197 a month) for full coverage and $648 a year (about $54 a month) for minimum coverage. Louisiana is the most expensive state, and Wyoming is the cheapest.
Key numbers at a glance:
- Most expensive state: Louisiana, $4,296 a year for full coverage (about $358 a month)
- Cheapest state: Wyoming, $1,148 a year (about $96 a month)
- Gap between them: $3,148 a year
- Highest minimum-coverage cost: New Jersey, $1,597 a year. Lowest: Wyoming, $192
I’m a developer and SEO specialist, not an insurance agent. I put these medians in one place so you can see your state at a glance, and every source is listed at the bottom.
Average Car Insurance Cost by State: The Full 2026 Table

Here are all 50 states and Washington, D.C. Each figure is a median annual premium, and the monthly figure is the annual figure divided by 12.
What the columns mean: In this data, full coverage includes $100,000 per person and $300,000 per crash in bodily injury liability, $50,000 in property damage, uninsured motorist cover, and collision and comprehensive with $1,000 deductibles. Minimum coverage is whatever your state requires by law.
| State | Full coverage a year | About a month | Minimum coverage a year | About a month |
|---|---|---|---|---|
| Alabama | $2,259 | $188 | $489 | $41 |
| Alaska | $1,833 | $153 | $383 | $32 |
| Arizona | $2,940 | $245 | $935 | $78 |
| Arkansas | $2,644 | $220 | $543 | $45 |
| California | $1,894 | $158 | $618 | $52 |
| Colorado | $3,279 | $273 | $742 | $62 |
| Connecticut | $2,871 | $239 | $1,008 | $84 |
| Delaware | $2,643 | $220 | $1,056 | $88 |
| Florida | $3,295 | $275 | $854 | $71 |
| Georgia | $3,160 | $263 | $1,056 | $88 |
| Hawaii | $1,975 | $165 | $603 | $50 |
| Idaho | $1,999 | $167 | $434 | $36 |
| Illinois | $2,546 | $212 | $754 | $63 |
| Indiana | $1,920 | $160 | $506 | $42 |
| Iowa | $2,233 | $186 | $397 | $33 |
| Kansas | $2,530 | $211 | $625 | $52 |
| Kentucky | $3,298 | $275 | $832 | $69 |
| Louisiana | $4,296 | $358 | $1,256 | $105 |
| Maine | $1,713 | $143 | $531 | $44 |
| Maryland | $3,013 | $251 | $1,092 | $91 |
| Massachusetts | $1,867 | $156 | $632 | $53 |
| Michigan | $2,950 | $246 | $685 | $57 |
| Minnesota | $2,508 | $209 | $649 | $54 |
| Mississippi | $2,502 | $209 | $594 | $50 |
| Missouri | $2,622 | $219 | $696 | $58 |
| Montana | $2,879 | $240 | $453 | $38 |
| Nebraska | $2,001 | $167 | $431 | $36 |
| Nevada | $3,497 | $291 | $1,033 | $86 |
| New Hampshire | $1,578 | $132 | $458 | $38 |
| New Jersey | $3,687 | $307 | $1,597 | $133 |
| New Mexico | $2,203 | $184 | $505 | $42 |
| New York | $2,673 | $223 | $1,021 | $85 |
| North Carolina | $1,789 | $149 | $598 | $50 |
| North Dakota | $2,423 | $202 | $507 | $42 |
| Ohio | $1,795 | $150 | $503 | $42 |
| Oklahoma | $2,221 | $185 | $495 | $41 |
| Oregon | $2,214 | $185 | $970 | $81 |
| Pennsylvania | $2,208 | $184 | $439 | $37 |
| Rhode Island | $3,226 | $269 | $873 | $73 |
| South Carolina | $2,479 | $207 | $678 | $57 |
| South Dakota | $2,236 | $186 | $377 | $31 |
| Tennessee | $2,134 | $178 | $522 | $44 |
| Texas | $3,652 | $304 | $1,085 | $90 |
| Utah | $2,429 | $202 | $902 | $75 |
| Vermont | $1,556 | $130 | $429 | $36 |
| Virginia | $2,165 | $180 | $772 | $64 |
| Washington | $2,332 | $194 | $693 | $58 |
| Washington, D.C. | $2,655 | $221 | $892 | $74 |
| West Virginia | $2,274 | $190 | $680 | $57 |
| Wisconsin | $2,335 | $195 | $556 | $46 |
| Wyoming | $1,148 | $96 | $192 | $16 |
Source: NerdWallet’s October 2026 rates analysis.
How to read this table
- These are medians, not quotes. Your real price depends on your insurer, your city and your car.
- The driver is a 35-year-old with good credit and a clean record. Younger drivers and drivers with violations pay more. See how much car insurance goes up after a speeding ticket, accident or DUI.
- Use the US median of $2,361 as a yardstick. If your state sits well above it, shopping around matters even more.
The Most and Least Expensive States for Car Insurance

Five most expensive states (full coverage)
| State | Full coverage a year | About a month |
|---|---|---|
| Louisiana | $4,296 | $358 |
| New Jersey | $3,687 | $307 |
| Texas | $3,652 | $304 |
| Nevada | $3,497 | $291 |
| Kentucky | $3,298 | $275 |
Louisiana costs about 82% more than the national median. Florida is right behind Kentucky at $3,295.
Five cheapest states (full coverage)
| State | Full coverage a year | About a month |
|---|---|---|
| Wyoming | $1,148 | $96 |
| Vermont | $1,556 | $130 |
| New Hampshire | $1,578 | $132 |
| Maine | $1,713 | $143 |
| North Carolina | $1,789 | $149 |
Wyoming sits about 51% below the national median, which makes it the clear outlier.
Full Coverage vs Minimum Coverage by State
Nationally, full coverage costs about $1,713 a year more than minimum. The gap isn’t the same everywhere:
- Biggest gaps: Louisiana ($3,040), Texas ($2,567), Colorado ($2,537), Kentucky ($2,466) and Nevada ($2,464)
- Smallest gap: Wyoming ($956)
- Highest minimum-coverage cost: New Jersey ($1,597), Louisiana ($1,256), Maryland ($1,092) and Texas ($1,085)
- Lowest minimum-coverage cost: Wyoming ($192), South Dakota ($377), Alaska ($383) and Iowa ($397)
Minimum coverage pays for damage you cause to other people. It doesn’t repair your own car. If you finance the car, your lender will usually require full coverage anyway, and you can model the loan in Loan Analytics Pro.
Why Car Insurance Costs More in Some States
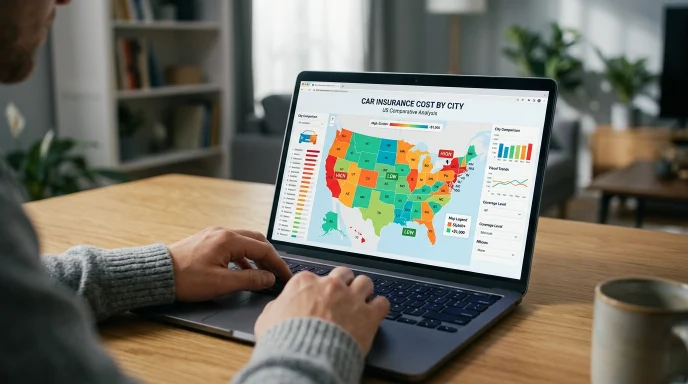
There’s no single reason. According to The Zebra, these location factors push premiums up:
- Collision rates. More accidents mean more claims.
- Vehicle theft. Higher theft means higher premiums.
- Natural disasters. Places hit by hurricanes, floods or hail pay more. The Zebra points to Florida and Louisiana as examples.
- Uninsured drivers. More of them means more costly uninsured-driver claims.
- Population density. More cars on the road raises the chance of a crash.
- State regulations. Each state sets its own insurance laws and minimum coverage.
Your City Can Matter More Than Your State
A state median hides big differences inside the state. Here are full-coverage annual premiums for four cities in each of two states, from The Zebra’s October 2026 table:
| California | Full coverage a year | Texas | Full coverage a year |
|---|---|---|---|
| Los Angeles | $3,707 | Houston | $3,130 |
| San Francisco | $3,039 | Dallas | $3,106 |
| Oakland | $3,026 | Austin | $2,616 |
| San Diego | $2,481 | El Paso | $2,539 |
That’s a gap of $1,226 a year inside California and $591 inside Texas. One caution: The Zebra’s city table and NerdWallet’s state table use different driver profiles, so don’t subtract one from the other. Compare cities with cities and states with states.
How to Find Your Own Price
A state average is a starting point. Here’s a simple way to get closer to your real number:
- Start with a range. Use our car insurance calculator without personal information. Pick your city or state, age, driving record and coverage level, and you get a monthly and yearly range with no name, email or VIN.
- Adjust for your record. A ticket, crash or DUI changes the picture a lot.
- Get three real quotes for the same coverage and deductibles.
- Re-shop every year, and again after a move.
Moving to a cheaper state? Insurance is only one part of the cost. The Rent vs Buy Calculator helps you compare housing, and the Income Tax Calculator 2026 shows what you’d take home.
Common mistakes when comparing states
- Treating a state median as your quote. It’s a yardstick, not a price.
- Comparing numbers from different sources. Each source uses its own driver profile.
- Choosing a state on insurance alone. Housing, taxes and jobs usually matter more.
Quick checklist
- I found my state in the table
- I know whether I’m above or below the $2,361 national median
- I’ve estimated my own range with the calculator
- I’ve got three quotes for the same coverage
Frequently Asked Questions
What is the average car insurance cost by state?
The US median is $2,361 a year ($197 a month) for full coverage and $648 a year ($54 a month) for minimum coverage. By state, full coverage ranges from $1,148 in Wyoming to $4,296 in Louisiana.
Which state has the cheapest car insurance?
Wyoming, at $1,148 a year for full coverage (about $96 a month) and $192 a year for minimum coverage. Vermont, New Hampshire, Maine and North Carolina are next for full coverage.
Which state has the most expensive car insurance?
Louisiana has the highest full-coverage median at $4,296 a year, about $358 a month. New Jersey has the highest minimum-coverage median at $1,597 a year.
What is the average car insurance cost per month?
About $197 a month for full coverage and $54 a month for minimum coverage, for a 35-year-old with good credit and a clean record.
Why is car insurance so expensive in some states?
Collision rates, theft, severe weather, uninsured drivers, population density and state laws all play a part. Places with more of these risks tend to have higher premiums.
Is the average the same as my quote?
No. These are medians for a 35-year-old with good credit and a clean record. Your age, record, credit, city, car and insurer all change the number. See how a ticket, accident or DUI changes your rate.
How can I estimate my car insurance without giving personal information?
Use the free calculator. It asks only for a city or state, an age bracket, a driving record and a coverage level.
Conclusion
The average car insurance cost by state can differ by more than $3,000 a year, so where you live is the first thing to check. Find your state in the table, compare it with the $2,361 national median, then get your own range with the calculator. After that, compare three real quotes.
For more free money tools, browse our Finance Tools.
Sources (checked October 2026): NerdWallet for state medians and The Zebra for city rates and location factors. This page gives general information, not an insurance quote or financial advice. See our disclaimer.